5 Conclusion
The three pieces of work in this thesis focus on diagnostics, data structure, and the pipeline workflow of contemporary multivariate spatio-temporal data. Chapter 2 introduces four plots that provide diagnostics of projection pursuit optimisation. When combined with guided tour, we can visualise the optimisation path of high-dimensional projection bases. While it is difficult to overcome failure encountered during optimisation in projection pursuit, the diagnostic plots implemented in this work provide a visual tool to understand its cause. These plots have been implemented in the R package ferrn, which has been on CRAN since March 2021 and has received over 8000 downloads from the CRAN mirror.
Many scientific fields heavily rely upon spatio-temporal data, which comprise time series data recorded at discrete locations. Examples of which include weather stations and river gauges. The second topic of the thesis aims to provide benefit to environmental scientists by making it easier to work with spatio-temporal data in different forms: pure spatial, pure temporal, and combined spatio-temporal. Chapter 3 discusses a new spatio-temporal data structure, applicable to both vector and raster data, that can easily pivot among these forms. Additionally, the data structure is also compatible with modern spatial and temporal data structure (sf and tsibble). The data structure is implemented in the cubble package, which has been on CRAN since August 2022 and has received over 45 stars on GitHub and over 5000 downloads from the CRAN mirror. The presentation of cubble on the Early Career and Student Statisticians Miniconference 2022 has won the People’s Choice award.
Indexes are used in society to communicate complex multivariate information to the public or to make decisions. For example, drought and climate indexes guide the early warning monitoring systems in recommending actions for agriculture and other weather-dependent industries. The third topic of the thesis orchestrates a wide array of indexes proposed in various fields (in natural science, economics, and social science) to standardise the steps in index construction and analysis. The data pipeline proposed in Chapter 4 suggests a set of modulated steps for assembling indexes from multivariate spatio-temporal data under the tidy framework. The suggested pipeline offers a unified syntax for performing tasks that are universally applicable to indexes across all domains, including computing the index with different parameters, evaluating the robustness of the index, and calculating uncertainty measures. The tiydindex package that implements the data pipeline is currently a proof of concept for the pipeline workflow and is planned to be submitted onto CRAN.
5.1 Future work
Optimisers for projection pursuit optimization
The optimisation in projection pursuit is a high-dimensional problem that aims to optimise the interesting statistics, also called the index function, on the projection matrices. This objective function could be non-linear, computationally expensive to calculate the gradient, and may have local optima, which are also interesting for projection pursuit to explore, along with the global optimum. When approaching a new problem, users often try the three available stochastic optimizers introduced in Section 2.3.1, with different parameterizations, to find the optimizer works the best for the problem on hand. Optimizers that have shown success in other domain applications from the optimisation literature, such as genetic algorithms, can be tested for performance in addressing the projection pursuit optimisation.
Extending the glyphmap to other glyphs
The cubble approach transforms the time series lines from the temporal coordinates to the spatial coordinates and plots them as a glyph on the map. This is different from insetting a set of plots onto a base map, which could lead to plot overlap when observations are closely located. The glyph map approach can be generalised to transform different shapes including points and polygons, or even plots, from one set of coordinate to another. This would allow to display more complex glyphs, for example, a scatterplot of two variables, against each other, to observe multivariate spatio-temporal relationship simultaneously on the map.
Applying the tidyindex framework for domain specific indexes
The tidyindex work introduced in Chapter 4 can be further expanded into a suite of tools, like tidymodel, for constructing and analysing indexes. The next step is to apply the index pipeline to specific domains, for example, drought indexes. Drought is a natural phenomenon with persistent lack of water and is monitored for meteorological, agricultural, hydrological, and social economic purpose. Despite hundreds of drought indexes proposed in the literature, there lacks a consensus among researchers on which index, or combination of indexes, to adopt for practical problems. The tidyindex pipeline can be extended to domain-specific toolkits for researchers to build, share, and compare their indexes.
5.2 Final remark
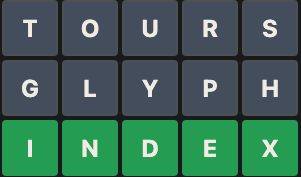
Figure 5.1 shows three five-letter words, each representing a keyword in the three main chapters of this thesis, arranged in the layout of a Wordle puzzle. Interestingly, “glyph” emerged as the Wordle solution on 18th November 2022, and “index” claimed its place on 15th August 2023 - just before the thesis submission! This evokes a similar feeling to come across the crossword clue “corolla leaf” (consider the variable name of the iris data), or alternatively, spot the Adélie penguins in the Sea Life.
